
Every operator I’ve worked with has at some point told me a version of this: “I have all the data. I just can’t see what’s going on.”
It’s a strange sentence when you say it out loud. How can you have the data and not see what’s going on? But anyone who’s actually run a business with moving parts knows exactly what it means. The numbers exist. The reports get sent. The dashboards inside the POS and the booking platform and the e-commerce backend all show something. And still, on any given Monday morning, the operator can’t answer simple questions about their own business with confidence.
That gap between having data and seeing what’s going on is what operational visibility is supposed to close. Most businesses think they have it because they have reports. They don’t. This article is about what operational visibility actually means, why most operators are flying blinder than they realise, and what changes when real operational visibility is in place.
Visibility is not the same as reporting
The first confusion to clear up is the language. Reporting and visibility get used interchangeably, and they shouldn’t.
The clearest way to understand operational visibility is to compare it to what most businesses already have, reporting, and notice where the two diverge. Reporting is the act of producing a record of what happened. A monthly revenue report, a weekly utilisation summary, a quarterly P&L. It’s retrospective by design. Its job is to document.
Visibility is something else. Visibility is the ongoing ability to see, at any moment, what’s happening across the parts of your business that matter and to recognise when something is shifting. It’s not a document. It’s a state.
The distinction matters because most businesses invest in better reporting and assume they’re investing in better visibility. They’re not. You can have weekly reports, monthly reports, and quarterly reviews and still have terrible operational visibility, because none of those tell you what’s happening right now across the dimensions you need to watch.
Operational visibility is to reporting what a window is to a photograph. The photograph shows you what was. The window shows you what is.
In hospitality, the version of this problem is the gap between utilisation vs occupancy that quietly drains revenue, same pattern, different shape.
The four dimensions of real operational visibility
When I work with operators on this, we usually end up mapping their visibility against four specific dimensions. A business has real operational visibility when it can answer questions in all four, not just one or two. Weakness in any one dimension creates an operational visibility gap, and most businesses have gaps in three out of four without realising it.
- Time. Can you see what’s happening this week, today, this hour? Or are you always looking at last month’s numbers? Most businesses have decent monthly visibility, weak weekly visibility, and almost no daily or hourly visibility. The narrower the time slice you can see clearly, the faster you can act.
- Location and channel. Can you see each location, each channel, each unit separately, or only as a blended total? A business with three locations and one combined report has effectively one-third of the visibility it should. Same goes for channels: online vs in-store, direct vs marketplace, walk-in vs booking. If they’re blended in your view, you’re flying with a smaller instrument panel than you have. This is especially acute in multi-location businesses. Averages across a network of locations are one of the most common ways operational visibility quietly fails, because the headline number stays calm while individual locations diverge.
- Demand and capacity. Can you see not just what was sold, but when demand is concentrated and how that maps against your available capacity? An operator who can see “we did $12,000 yesterday” has revenue visibility. An operator who can see “we did $12,000 yesterday, concentrated between 5pm and 8pm, with two no-shows in the gap and a 40-minute wait at 6:30pm” has operational visibility. Same business, different altitude.
- External variables. Can you see how external factors like weather, season, day of week, local events, holidays, are affecting your demand? For many businesses, external variables explain more of week-to-week variance than anything they control internally. If you can’t see that, you’re attributing patterns to your own decisions that were actually being driven by the weather forecast. Geographic patterns are the fourth dimension most operations dashboards skip. I’ve written separately about why geospatial analysis beats spreadsheets for transport operations and the same principle applies anywhere route concentration matters.
External variables belong in the operational view too. Weather and demand, for example, move together more closely than most reports show, and a dashboard that ignores weather is silent about a large fraction of the variance it’s trying to explain.
A business with strong visibility can read across all four. Most businesses I see have one of the four reasonably covered and the other three either missing or guessed at.
Datasets like NOAA’s historical climate records or Google Trends regional data make these external variables quantifiable for businesses willing to merge them with their own operational data.
For a worked example of this in practice, see the Citi Bike strategic dashboard case study, it shows how operational visibility gets built from raw transport data.
Why most operators have less visibility than they think
The reason this gap exists almost universally is that visibility takes deliberate work to build, and most businesses have grown into their current size without building it. The systems were added one at a time, a POS here, a booking system there, a marketing tool, an inventory app, and each one came with its own little dashboard. The operator ended up with seven separate windows into the business, each showing a slice, none of them showing the whole.
This is the part operators often resist hearing: the more software you’ve added, the worse your operational visibility usually gets, not better. Each new tool fragmented the picture. Each one introduced its own definition of “customer” or “order” or “active user.” Each one became another tab to check, another login to remember, another export to wrestle with at month-end.
The result is the sentence I started this article with. You have all the data. You can’t see what’s going on. Because the data is spread across seven places, defined seven different ways, and visible only when you go looking for it.
The other reason operational visibility gets neglected is that it’s not urgent. Nothing breaks loudly when visibility is poor. A business with bad visibility just makes slightly worse decisions, slightly more often, for years at a time, until something obvious goes wrong and the operator looks back and realises they couldn’t see the warning signs because they weren’t looking at the right view.
A specific symptom of this is reports that don’t direct action. I wrote separately about why monthly sales reports stop working past a certain point, it’s the most common version of the visibility gap, but it’s not the only one. Booking utilisation reports, inventory turnover summaries, staff productivity dashboards all have the same problem when they’re built as records rather than as views.
This is one of the patterns I keep coming back to in the KPI trap that most operations dashboards fall into, measuring what’s easy instead of what drives decisions.
McKinsey has called this fragmentation “the silent tax of operational complexity”, every system added without consolidation makes the whole picture harder to see, not easier.
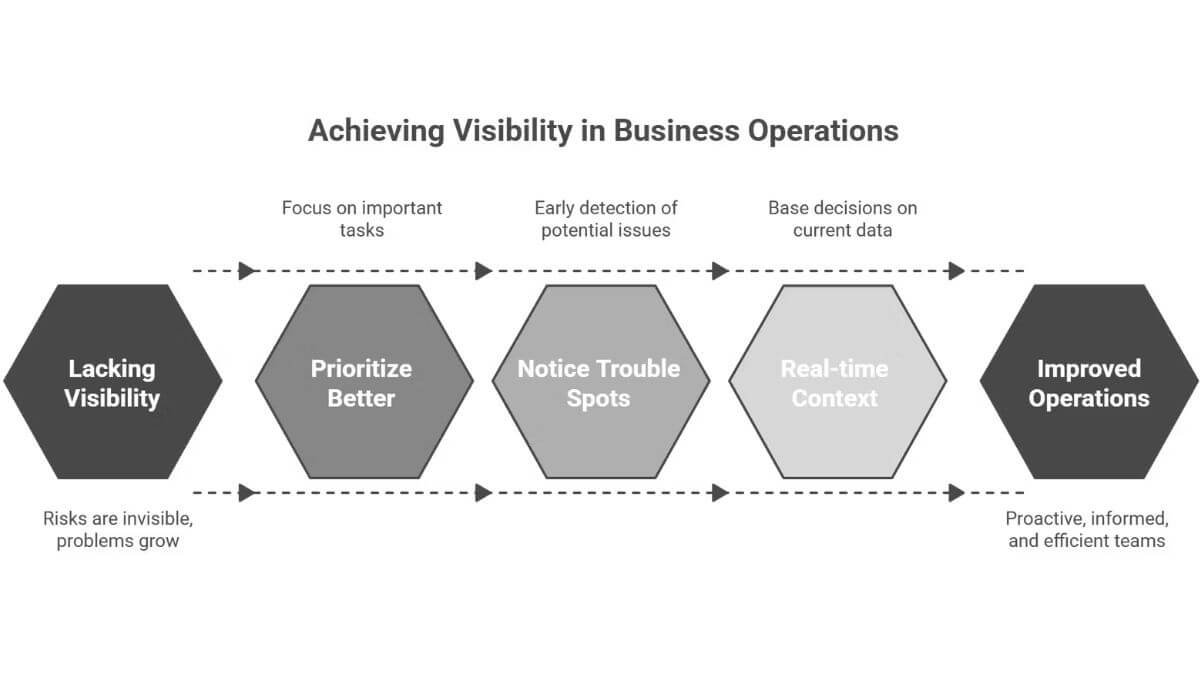
What changes when you actually have visibility
Real operational visibility doesn’t just give you more numbers. It changes the kind of decisions you can make. This part is hard to describe to operators who haven’t experienced it, because the change is qualitative, not quantitative. It’s not that you start hitting different numbers. It’s that you start making different decisions.
A few things shift:
You stop being surprised. The big shifts, the slow decline of a location, the emergence of a new peak hour, the slow drop in average ticket size, become visible while they’re forming, not after they’ve already happened. You stop having “wait, when did this start?” moments.
You stop guessing about external factors. Instead of debating with your manager whether it was the weather or the long weekend or the new competitor, you look. You know.
This is where the lagging vs leading indicators distinction starts to matter: once you have the data, the next question is which signals trigger which decisions.
Your meetings change. Operational meetings stop being about reading numbers aloud and start being about decisions. The numbers are already known by everyone in the room before the meeting starts.
But visibility on its own is not enough, if your team does not open the dashboard, the visibility never reaches the decisions. I have written separately about why dashboard adoption fails and what fixes it.
You delegate differently. With real visibility, you can give a location manager or department head responsibility for specific metrics that they can also see. Without it, you’re delegating outcomes without giving people the instrument panel to manage them.
You make smaller, more frequent adjustments. Bad visibility forces big, lagging decisions, “we need to restructure” or “we need to cut costs across the board.” Good visibility lets you make small adjustments week to week, which compound far more reliably than dramatic ones.
These aren’t dramatic transformations. They’re the quiet kind. But over a year or two, they’re the difference between a business that runs you and a business you run.
How to know whether you actually have visibility
A short diagnostic, similar in spirit to the one in the sales report piece but broader. Try answering these without looking anything up:
- What were your three highest-volume hours last week, and at which location?
- Which of your locations or channels grew slowest in the last 90 days?
- What percentage of your demand variance can you attribute to weather, season, or external events?
- If demand dropped 15% next week at one location, would you notice before the monthly report?
- Can your direct reports see the same numbers you see, in the same view, at the same time?
If you found yourself uncertain on three or more of those, your operational visibility is weaker than your business needs it to be. That doesn’t mean you’re doing anything wrong, it means you’ve outgrown your current setup, which is normal as businesses scale.
For operators specifically running multi-location businesses, this gap shows up first in cross-location comparisons. I wrote a separate piece on the five operational views every multi-location operator should be checking weekly, those views are essentially what visibility looks like applied to that specific structure.
For seasonal businesses, this becomes a year-round planning problem rather than a monthly reporting problem. The seasonality framework for transport and mobility operations shows what that shift looks like in practice.
What real visibility looks like in practice
Real operational visibility, in practice, isn’t complicated, it’s just deliberate. The shortest version: a small set of views, built from your actual data, designed around the decisions you actually make, available to you on a cadence that lets you act before the window closes.
It’s not a Power BI deployment. It’s not a 30 tab spreadsheet. It’s not a wall of KPIs that nobody reads. It’s a focused operational tool, usually three to seven views that you open at the start of each week and close knowing what to pay attention to, where the pressure is, and what’s drifting.
The data to build it almost always exists already. The systems you already have generate enough raw material. What’s missing is the deliberate work of consolidating it, defining what matters, and shaping the views around real decisions instead of around what the software vendor decided to put on the default screen. That’s the work I do as a service, the project starts with the business questions you need to answer and ends with a tool that answers them on an ongoing basis.
But whether you build it yourself, hire someone, or commission it from a freelancer, the principle is the same: visibility is a deliberate construction. It doesn’t happen by accident, and no off-the-shelf tool will produce it for you. Every business that has it built it on purpose.
The shift worth making
Most operators don’t need more data. They have plenty. Most operators don’t need more reports. They have plenty of those too. What most operators need is to stop confusing the act of receiving information with the act of being able to see clearly.
Reporting tells you what was. Visibility tells you what is. The businesses that learn to invest in the second one, even at the cost of producing fewer of the first, make better decisions, more often, with less drama. Operational visibility is the quietest competitive advantage there is. And it’s available to anyone willing to do the work of building it.
I build custom operational dashboards for businesses with hidden demand patterns, multi-location retail, transport and logistics, booking-based services, e-commerce, and hospitality. The work starts with the decisions you need to make, not the charts.
See how the dashboard service works → or explore other data services if you’re not sure what you need.
Pingback: How Every Multi-Location Business Hides Its Biggest Wins
Pingback: Your Monthly Sales Report Is Broken - Here's the Fix
Pingback: Weather and Demand: Why Reports Miss the Biggest Variable
Pingback: Why Averages Destroy Multi-Location Operations
Pingback: Citi Bike Case Study: A Powerful Mobility Dashboard Build
Pingback: Multi-Store Retail Analytics: A Proven Framework
Pingback: Geospatial Analysis: Smarter Operations, Better Results
Pingback: The KPI Trap: Why Smart Dashboards Fail
Pingback: Dashboard Adoption: 7 Hidden Reasons Your Team Ignores It
Pingback: Lagging vs Leading Indicators: The Critical Operations Gap
Pingback: Utilisation vs Occupancy: The Costly Hotel Mistake