Your Saturday in the middle of March looked nothing like the forecast. The booking system said you’d be at 82% occupancy. You finished the day at 61%, with the restaurant only half full and three staff sent home at 4pm. By the time the manager pulled the daily report on Monday, the only explanation anyone offered was the weather. A cold front pushed through Friday night, the temperature dropped six degrees below the seasonal average, and 19 millimetres of rain fell across Saturday afternoon.
That single weekend cost the hotel about $14,000 in revenue versus forecast. And the worst part is that the weather had been visible on the Bureau of Meteorology’s seven day outlook, since the previous Wednesday. The information existed. It just wasn’t connected to anything operational.
For operators searching for weather data integration in Australia, this is the real problem: the forecast already exists, but it is not joined to the booking, staffing and revenue data where decisions are made.
I’ve done this exact kind of merge before, joining a full year of external weather data to public bike share trip records, and the project made sense: weather only becomes useful when it is connected to real demand data.
This article is about how to fix that. Weather data integration for Australian hospitality is not a complicated piece of software. It is a structured way of joining external weather data to your existing booking and demand records, so your demand forecast can account for rain, heat, cold, and other conditions before they affect the operation.
Here’s what you actually need to do, in plain language.
Which weather data should Australian hotels use?
The Bureau of Meteorology (BoM) is the right source for almost every Australian hospitality business. It’s free, reliable, locally calibrated, and updated multiple times per day. International providers like OpenWeather have their place, but for weather data integration in Australia, BoM observations are more accurate at the regional level.
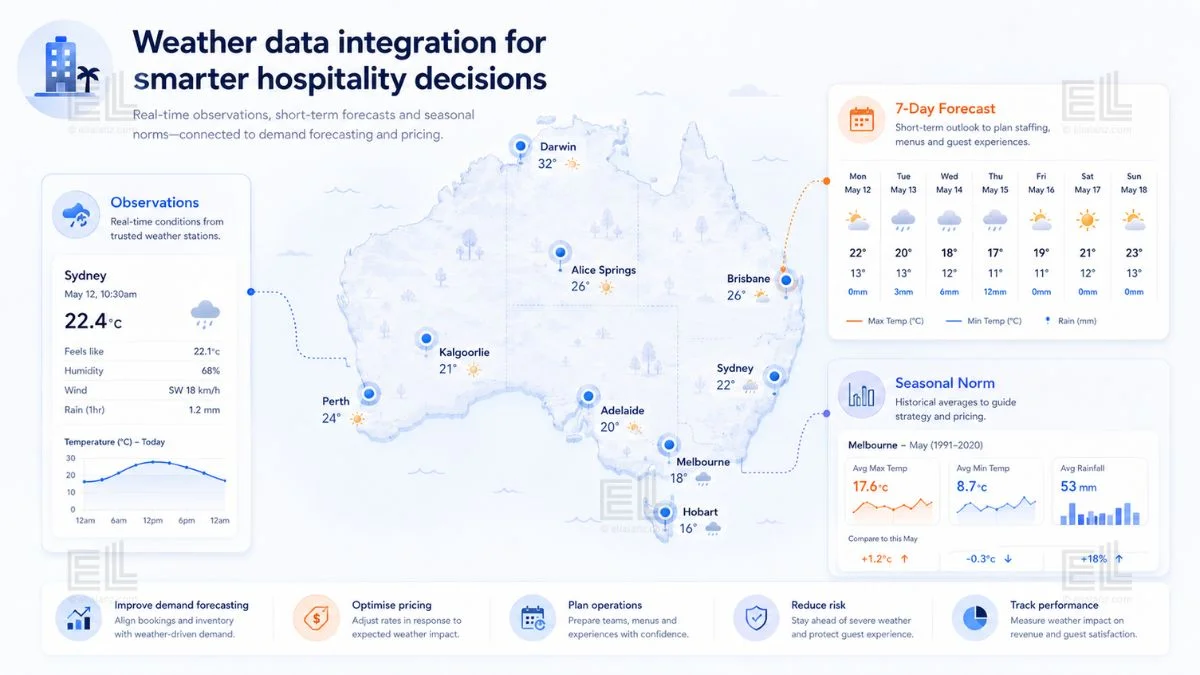
There are three BoM data products that matter for hospitality operations:
The first is observation data: what actually happened. Daily maximum and minimum temperature, rainfall, humidity, and wind. This is what you join to your historical bookings to figure out how weather actually moves your demand.
The second is the seven day forecast: what BoM expects to happen. This is the data you’d pull into a demand view that looks ahead, the one that helps you make staffing and pricing decisions before the week starts.
The third is regional climatology: the long term averages for your specific area This is the layer that lets you say “warmer than usual” or “wetter than usual” instead of just reporting raw numbers, which is what actually matters for forecasting.
For most small to mid hospitality operators, daily resolution observations and forecasts are enough. Hourly resolution is nice for restaurants with strong lunch/dinner splits, but it adds complexity that most operations can’t yet use.
How do you join weather data to booking data?
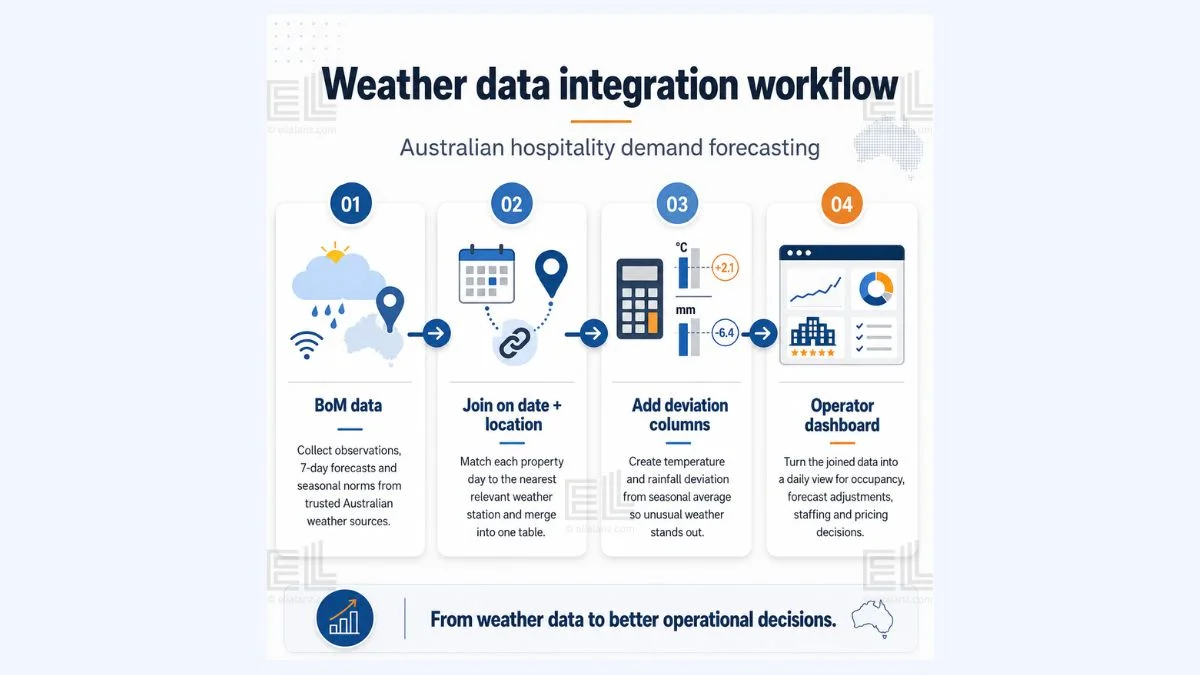
Weather data integration in Australia comes down to joining on date and location. That’s it. The technical pattern is straightforward: one row per day per property, one column for the demand metric you care about (occupancy, ADR, F&B covers, total revenue), and a set of columns for the matching weather observations from the nearest BoM station.
The harder part isn’t the join. It’s deciding what counts as “your” weather. A Gold Coast hotel cares about Coolangatta observations, not Brisbane Airport. A Hunter Valley resort cares about local Cessnock data, not the Sydney CBD reading. Pick the closest BoM station that actually represents the conditions your guests are experiencing, not the closest capital city.
Once the join is in place, you have a single table that lets you ask the question you’ve never been able to ask cleanly before: what does occupancy actually do when it rains?
A good weather data integration for Australian hospitality answers that question for your specific property, not for hospitality in general.
What’s the right granularity?
Daily data is the default for weather data integration in Australia. It matches how most Australian hotels already think about demand, and it is usually the level where BoM data is most useful.
Go hourly only if you have a specific operational reason. Restaurants with strong weather sensitive outdoor seating need hourly. Pool bars need hourly. A 90 room city hotel that earns most of its revenue from room nights does not need hourly data. Daily data is enough.
Use weekly aggregates only for long term trend work, not for operational decisions. A weekly view will hide the storm that wrecked your Saturday.
How do you separate weather effects from seasonality?
This is where most attempts at weather data integration in Australia fall over. People look at a graph, see that occupancy drops in winter while temperatures are lower, and conclude that cold weather caused the drop. It doesn’t. Winter causes the drop. The cold is correlated, but not causal.
To separate weather from seasonality, you compare to the local seasonal norm, not to the annual average. A 14°C day in July is normal in Melbourne. A 14°C day in February is unusual and will absolutely move your bookings. The same raw temperature means completely different things depending on when it happens.
The practical move is to add two columns to your joined dataset: temperature deviation from seasonal average and rainfall deviation from seasonal average. These deviation columns are what you actually model against demand. Raw temperature is misleading. Deviation tells you when the weather is doing something your guests aren’t expecting.
When I worked on the Citi Bike case study, the weather merge looked deceptively simple on paper. Pull a full year of daily average temperatures from NOAA’s API for the LaGuardia Airport station, join it to trip data on the date column, done. In practice there were two details that mattered.
The first is that NOAA returns temperatures in tenths of a degree Celsius. A value of -189 in the raw output actually means -18.9°C. If you skip that conversion, every downstream chart becomes unreadable. The second is that a left join alone isn’t enough; you want an indicator flag on the merge so you can verify every trip date matched a weather record before trusting the joined table. The same two details apply to a hospitality weather merge using BoM data. The exact API is different. The discipline is identical.
What does the integrated view look like in practice?
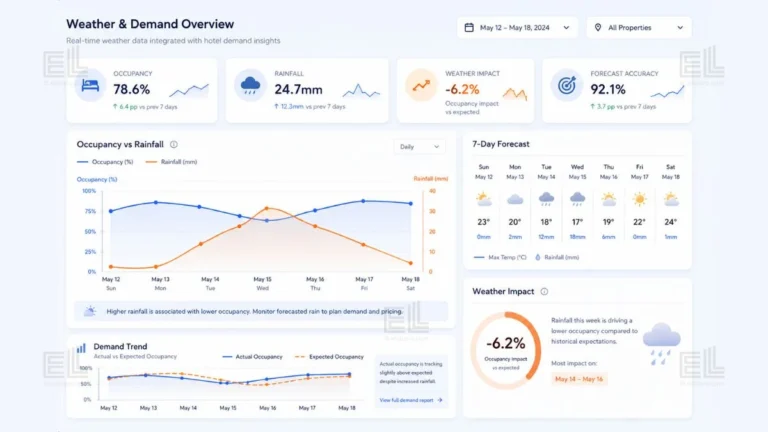
For a boutique hotel with 60 rooms in regional Victoria, a working weather data integration for Australian hospitality typically ends up as one dashboard with three panels.
Panel one shows actual occupancy versus forecast occupancy for the last 30 days, with weather deviation overlaid as a coloured band. When the band turns red (much hotter or wetter than seasonal norm) and the actual line dips below forecast, you can see at a glance whether your forecast missed because of weather.
Panel two shows the next seven days. It pulls the BoM forecast for your region, applies your historical weather demand sensitivity, and adjusts the booking pace forecast accordingly. If next Saturday is forecast to be 8mm of rain with a 5 degree cold drop, the panel flags an expected demand dip and a suggested staffing adjustment.
Panel three is the seasonality corrected scatter. It shows weather deviation on the x axis and demand deviation on the y axis, so you can actually see how sensitive your property is. Some hotels are barely affected by weather, such as city hotels with a strong corporate base. Others are extremely sensitive (regional resorts, beach properties, function heavy venues).
This is the structure that makes weather data integration for Australian hospitality useful instead of just interesting. It connects the BoM feed to a decision a manager actually makes.
Where does most weather data integration fail?
Three places, and they’re predictable.
It fails when the data lives in a separate tool. A weather widget on a dashboard isn’t integration. Integration means weather data sits in the same table as your booking data, available to every report and forecast you run. If your weather sits in a separate panel that no one looks at on Tuesday morning, the integration didn’t happen.
It fails when no one decides what to do with it. A beautiful chart of rainfall versus occupancy is worthless if it doesn’t connect to a staffing decision, a pricing decision, or a marketing decision. Pick two or three operational responses that the weather data will inform, and only those, before building anything.
It fails when it gets too ambitious. Most hotels don’t need a machine learning model. They need a single weather aware operational view, properly joined, that a revenue manager can read in under a minute. Start there. The fancier work comes later, if at all.
Where does weather data integration in Australia fit in the rest of your forecasting?
Weather is one input. It’s not the only one. A complete demand picture for an Australian hospitality business also includes day of week patterns, seasonality, school holidays, public holidays, local events, and channel mix. Weather sits inside that picture as one explanatory variable: important, but not enough on its own.
The right place to start is with the variable that explains the most variance in your specific business. For most regional and coastal Australian properties, that’s a tie between events and weather. For city corporate hotels, it’s day of week and channel mix, with weather as a smaller modifier. Don’t try to integrate every variable at once. Get weather right first, then add the next layer once the first one is being used in operations.
If you’re not sure whether weather actually matters enough for your property to justify the integration work, the diagnostic companion to this article, Does Your Hotel Actually Need Weather Data in Its Forecasting?, walks through five signs to check before you start.

What does a finished integration deliver?
A single operational view, weather aware, that a manager opens once a day. Forecast accuracy improves by somewhere between 8% and 22% in most properties, not by a transformative amount, but by enough to noticeably reduce staffing waste and recover revenue on weather affected days. The dashboard doesn’t replace the manager’s judgement. It gives the manager one more variable they can see clearly before deciding what to do next.
That’s the whole point. Weather data integration in Australia is not an AI play, a machine learning play, or an enterprise platform play. It’s a small, focused piece of analytical plumbing that connects free public data to the daily decisions you already make. The technical lift is modest. The improvement in operational clarity can be large.
If you would like a weather demand integration for your hotel or hospitality business, I offer a fixed scope service from $390, delivered in five business days. You get a single operational view that connects weather with your existing booking or demand data, ready to use.
Larger scopes such as multi-property, multiple data sources, or a full forecasting dashboard, are quoted separately. Get a 48 hour scope quote →
And if you’re not yet sure whether weather data even belongs in your forecasting in the first place, the diagnostic companion to this article, Does Your Hotel Actually Need Weather Data in Its Forecasting? Five Signs to Check First, walks through the five signs to check before you start.
I build custom operational dashboards for businesses with hidden demand patterns, multi location retail, transport and logistics, booking based services, e-commerce, and hospitality. The work starts with the decisions you need to make, not the charts.
See how the dashboard service works → or explore other data services if you’re not sure what you need.
Pingback: Weather and Demand: Why Reports Miss the Biggest Variable
Pingback: Utilisation vs Occupancy: The Costly Hotel Mistake
Pingback: Hotel Forecasting Weather Data: 5 Smart Signs