Retail customer segmentation built for commercial decisions.
An end-to-end analytics project that transformed online grocery transaction data into customer-level behaviour features, priority tiers, strategic customer segments, and a Power BI dashboard for retention, reactivation, upsell, and campaign targeting decisions.
From transaction data to customer action groups
The project was designed around a practical commercial question: which customers should a retail team protect, grow, upsell, reactivate, or simply monitor?
Business problem
A large online grocery customer base is difficult to act on when every customer is treated the same. The goal was to convert raw order behaviour into clear customer groups that could support CRM, marketing, retention, and commercial planning.
Final output
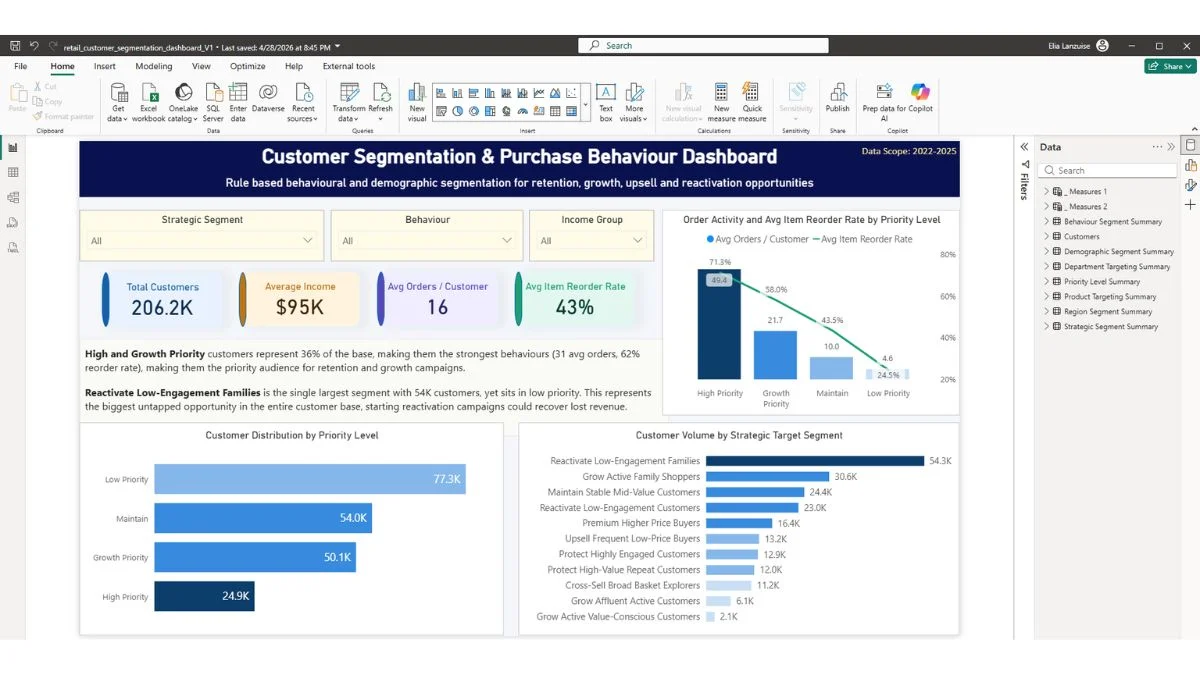
The final deliverable was a Power BI dashboard fed by structured Python exports: a customer-level segmentation table, strategic segment summaries, behaviour and priority summaries, demographic cuts, and transaction-level product/department targeting tables.
The dashboard was built to help stakeholders quickly identify high-value customers, active growth groups, stable mid-value segments, and the largest reactivation pools.
How the analysis was built
The Python work converted raw order, product, customer, demographic, and transaction-level data into a dashboard-ready analytics model.
A behaviour score built from four customer signals
Instead of relying on a single metric, customers were scored using a weighted blend of order frequency, reorder loyalty, product breadth, and product price behaviour.
Weighted behaviour score
The score was designed to separate customers by engagement, loyalty, breadth, and premium/value tendency while keeping each input comparable through percentile ranks.
24,852 customers. The strongest retention and loyalty protection group.
50,055 customers. Active shoppers with clear growth, upsell, or cross-sell potential.
54,017 customers. Stable middle-tier customers requiring monitoring and selective action.
77,285 customers. The largest group, mostly suited to reactivation or low-cost recovery campaigns.
11 customer groups mapped to business actions
The final model grouped customers into practical commercial actions rather than purely statistical labels.
Protect
High-priority customers with the strongest behavioural value.
- High-Value Repeat Customers11,972
- Highly Engaged Customers12,880
Grow
Active customers with clear potential for deeper targeting.
- Affluent Active Customers6,118
- Active Family Shoppers30,628
- Active Value-Conscious Customers2,073
- Broad Basket Explorers11,236
Maintain
Mid-tier customers where action depends on price and frequency signals.
- Premium Higher Price Buyers16,422
- Frequent Low-Price Buyers13,167
- Stable Mid-Value Customers24,428
Reactivate
Low-priority customers where the key question is whether recovery is worth the cost.
- Low-Engagement Families54,315
- Low-Engagement Customers22,970
Dashboard pages built around stakeholder questions
The Power BI report was structured to move from a high-level segmentation overview into behaviour, demographic, and targeting detail.
Executive Segmentation Overview
Shows customer volume, priority tiers, strategic segments, KPI cards, and the broad distribution of customers across action groups.
Behavioural Analysis
Compares customer groups by order frequency, reorder loyalty, product breadth, product price behaviour, and behaviour score.
Demographic Insights
Focuses on age, income, household group, and demographic profiles because those dimensions explain more useful differences than region alone.
What the segmentation made easier to decide
The dashboard turns customer complexity into practical campaign and commercial priorities.
Low Priority customers represent 77,285 customers, with Low-Engagement Families alone accounting for 54,315 customers. That creates a clear reactivation pool, but the campaign cost must be controlled.
Grow Active Family Shoppers is the largest growth-tier segment at 30,628 customers, making it a strong candidate for family-oriented offers, bundles, and category expansion campaigns.
The two Protect segments together represent 24,852 customers with the strongest engagement profile. These customers are better suited to loyalty protection, premium retention, and service-led messaging than generic discounting.
The Maintain tier was split into premium buyers, frequent low-price buyers, and stable mid-value customers so that the business can separate selective upsell from simple monitoring.
Checked for refresh, logic, and reporting reliability
The project included validation beyond visual design: data checks, row-count assertions, segment exhaustiveness, no-null checks, Power Query review, DAX measure review, and slicer state checks after the CSV rebuild.
Validation that protects trust
A segmentation dashboard only works if the segment logic, refresh process, and dashboard measures remain consistent after the data is rebuilt.
206,209 rows with demographics, behaviour metrics, percentile ranks, priority level, behaviour segment, and strategic target segment.
Aggregated strategic, priority, behaviour, region, and demographic summary tables for Power BI visuals.
Transaction-aggregated table by segment, priority, behaviour group, and department for category-level targeting.
Large product-level targeting export by segment, department, product, unique customers, unique orders, price, and reorder rate.
How the business could use the dashboard
Protect: prioritise retention, loyalty rewards, and premium customer treatment for the strongest engagement groups.
Grow: target active family shoppers, affluent active customers, and broad basket explorers with relevant bundle, category, and cross-sell campaigns.
Maintain: monitor stable mid-value customers, selectively upsell frequent low-price buyers, and preserve premium buyer value without over-discounting.
Reactivate: test low-cost recovery campaigns for low-engagement families and broader low-engagement customers before investing heavily.
What this project demonstrates
This case study demonstrates Python data preparation, customer-level feature engineering, segmentation logic, Power BI dashboard design, DAX-based reporting measures, quality checks, and the ability to translate analysis into stakeholder-ready recommendations.
Need the full portfolio or resume?
Download the PDF portfolio for a polished overview of the projects, or open the resume for the formal career summary, tools, and work history.