Most businesses already know weather affects their numbers. A wet Saturday in retail. A scorching weekday in food delivery. A cold snap that empties a hotel mid-week. The pattern is real, and most operators have seen it. What’s missing is the discipline of actually putting weather and operational data side by side and looking at them together.
That’s what weather data integration is. It’s not technical wizardry. It’s the simple act of taking your daily business numbers, sales, bookings, trips, orders, and matching each day’s number against that day’s weather. Once those two columns sit next to each other, patterns appear that no monthly report would ever show you.
This article walks through what weather data integration actually involves. The point isn’t to turn anyone into a data analyst. It’s to show that the work is more straightforward than it sounds, that the data you need is free, and that the operational payoff is real. The example throughout is bike-share data from New York, but the principles work the same whether you’re running a restaurant, a hotel, a delivery service, or a chain of retail stores.
For operators who want the conceptual version before getting into the integration mechanics, I’ve written a plain language guide on the business case for weather data integration.
Why Weather Data Belongs Next to Your Business Numbers
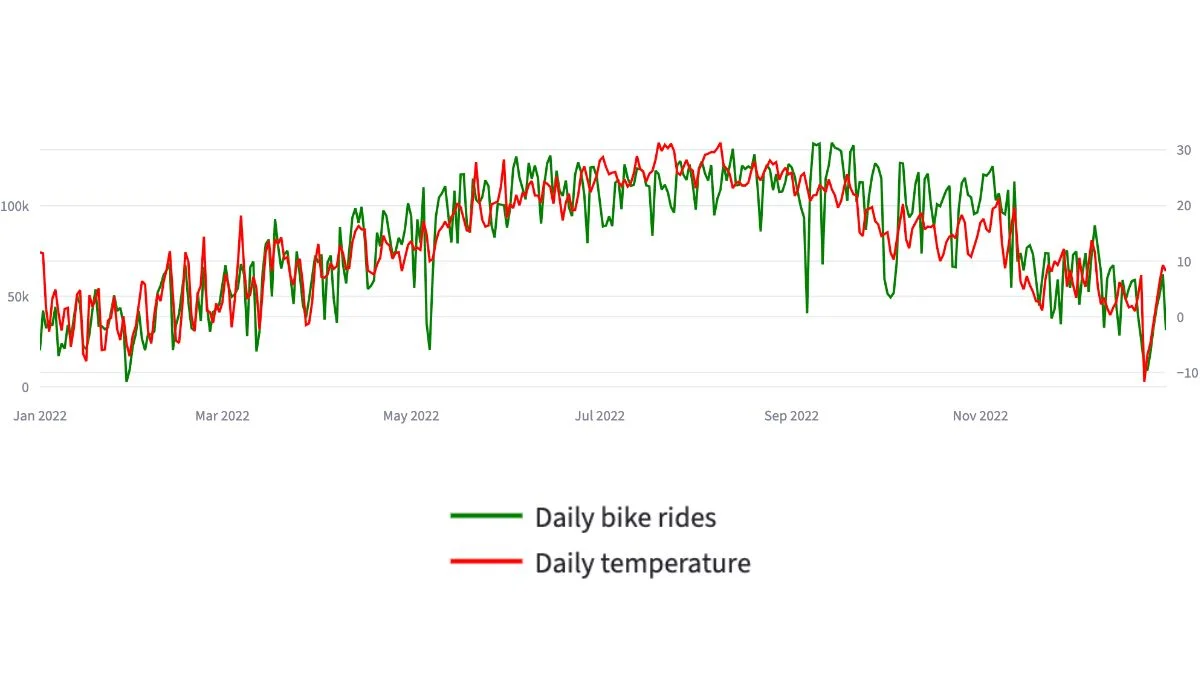
Weather changes demand more than most operators think. The size of the effect surprises people who haven’t measured it. In the Citi Bike 2022 data, daily trip volume and average daily temperature moved together with a correlation of around 0.85. In plain language: when temperature goes up, trips go up closely, predictably, across the whole year.
That kind of relationship doesn’t only exist in bike share. It shows up in any business where customer behaviour shifts with the weather. The difference between businesses that notice and businesses that don’t is whether they’ve actually put the two datasets next to each other.
Without weather data integration, every spike or dip in your operational numbers looks like a mystery. Sales dropped on Tuesday? Maybe it was the weather. Maybe it wasn’t. You can’t tell, so you don’t act. With weather data sitting next to your sales data, the question answers itself in seconds.
What “Merging” Actually Means
Weather data integration sounds technical, but the actual work is closer to filing than coding. The whole idea of weather data integration is this: you have two spreadsheets. One has your daily business numbers, date, sales, trips, bookings, whatever your operation produces. The other has daily weather records, date, temperature, rainfall, sometimes wind or sunshine hours.
The merge is the act of matching them by date. Monday 14 March in your sales file gets paired with Monday 14 March in the weather file. Repeat for every day in the period you care about. The result is one combined file where every business day now carries its own weather context.
That’s it. There’s no advanced statistics, no machine learning, no specialist tools required for the basic version of weather data integration. Excel can do it. Google Sheets can do it. Any analyst can do it. The hard part isn’t the merging, it’s getting the weather data in the first place, and making sure both files use the same date format. More on both of those in a moment.
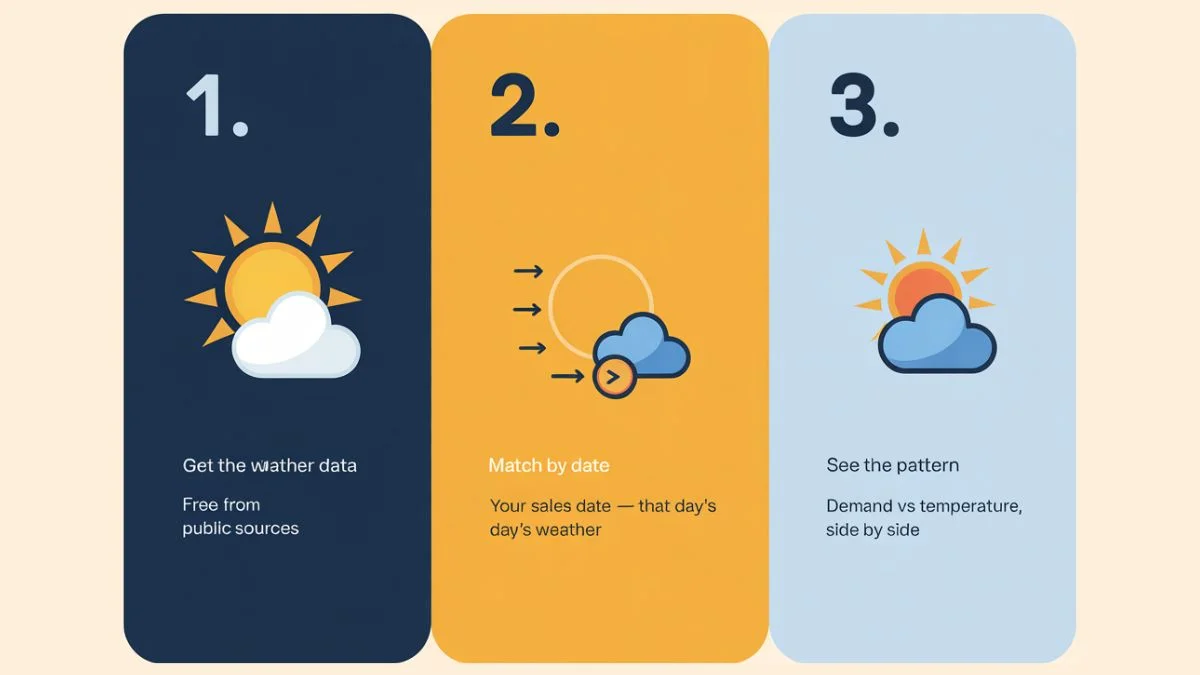
The Three Steps That Make Weather Data Useful
Step one: get the weather data. Most countries have a national weather service that publishes historical daily records for free. In the US, that’s NOAA. In the UK, the Met Office. In Australia, the Bureau of Meteorology. You pick the weather station closest to your business location, request the date range you want, and download the file. Most services let you do this through a web interface or an API. The web interface is fine for a one-off analysis. The API is better if you want to keep the data refreshing. The US Bureau of Transportation Statistics publishes free transport data.
Step two: clean the date column. This is where most weather data integration projects quietly break before they get going. Your sales file probably uses 14/03/2024 or 3/14/2024 or 2024-03-14. The weather file uses whichever format the weather service decided on. If the two formats don’t match exactly, the merge produces a file full of blank weather values where the dates couldn’t be paired. Sort this out before merging, pick one format and convert both files to it.
Step three: do the merge. In Excel, this is a VLOOKUP or an INDEX-MATCH. In Google Sheets, a similar lookup function. In Python or any data tool, it’s a one-line join. The output is a single file where each row is one business day, with your operational numbers in some columns and the weather data in others.
Once that file exists, you can see your daily numbers against the weather they happened in. That’s the whole point. Everything useful flows from there.
What Changes Once Weather Is in the Picture
The first thing that changes is the conversation about variance. Before weather data integration enters the picture, every unexpected dip or spike in your numbers prompts the same vague debate: was it the weather, was it our promotion, was it the staff shortage, was it the holiday? After integration, you can answer the weather part of that question in seconds. The other variables get clearer because you’ve removed the noise of one of the biggest unknowns.
The second thing that changes is forecasting. Once you know how strongly weather affects your business, the weather forecast becomes a forward-looking input rather than a casual mention. If tomorrow’s forecast is unusually cold and your data shows cold days produce 40% less foot traffic, you can adjust staffing, inventory, and marketing accordingly. That’s not speculation. That’s a decision based on the pattern your own data has already shown you.
The third thing, and this is where it gets interesting for transport, retail, hospitality, and any outdoor-exposed business, is seasonal planning. Weather data integration over a full year reveals the shape of your seasonal demand curve in a way that monthly sales totals can’t. You can see exactly which temperature thresholds your business is sensitive to, which weeks the shoulder seasons start and end, and how to plan the operating calendar around the actual climate of your location. The Citi Bike case study is built on exactly this kind of merge, and the same data drives the seasonal planning framework that came out of it.
The Mistakes That Quietly Break Weather Data Integration
There are a few traps that show up almost every time someone does this for the first time. They’re worth knowing in advance.
Mismatched date formats. Already covered above, but it’s the biggest one. Always check after merging that your weather columns aren’t full of blanks. If they are, the dates didn’t match.
Wrong unit conversion. Many weather services store temperature in unusual units. NOAA, for example, publishes daily temperature in tenths of degrees Celsius. So a value of 220 in the file actually means 22.0°C, not 220°C. If you forget to convert, every chart you build looks wrong by a factor of ten, and the correlation analysis becomes meaningless. Read the documentation of the weather service before you trust the numbers.
Wrong station location. Pick the weather station closest to where your business operates, not the closest one to the city centre. A bike-share business in Brooklyn shouldn’t be using a weather station in Manhattan if a Brooklyn station exists. The closer the station, the more accurate the integration.
Averaging that hides the signal. Daily averages are usually right for daily business data. But if your business is sensitive to specific weather moments, peak afternoon heat, morning frost, evening rainfall, a daily average can flatten the pattern. In that case, you want hourly weather data merged with hourly business data. More work, but worth it for businesses where the time-of-day pattern matters.
Treating one bad year as the rule. A single year of data is enough to see a strong pattern, but extreme weather events can distort it. If you can pull two or three years of data, the integration becomes more reliable.

What This Looks Like for a Real Business
Imagine a small hotel group with three properties in a tourist town. Their monthly reports show occupancy is uneven, some weeks are full, others half-empty, but the pattern doesn’t fit the school holiday calendar or the published events schedule. They’ve never been able to explain it precisely.
A simple weather data integration project would take their daily occupancy figures, merge them with daily temperature and rainfall for the local weather station, and look at the relationship between weather data integration and their occupancy patterns. They’d likely find that occupancy is much more weather-sensitive than they assumed, possibly even that certain rainfall thresholds produce predictable cancellation patterns. From that point on, weather forecasts become an operating input. Staffing, food and beverage stocking, and marketing budgets all get easier to plan.
This isn’t hypothetical. The same logic that worked for bike share works for hotels, restaurants, retail, transport, and any business where customer behaviour responds to the weather. The data is free. The merge is straightforward. The operational lift is substantial.
If this is the kind of work you’d like done properly beyond the basic Excel merge, into a real dashboard that combines operational data with weather and shows the patterns visually, that’s what a custom dashboard with weather built into it actually is. And if a custom dashboard isn’t quite what you’re after, maybe the data is messy and needs cleaning first, or you want a one-off analysis rather than an ongoing tool, data cleaning and integration is one of those other services I offer.
The big idea behind weather data integration is small. Take your daily numbers. Take the weather. Put them next to each other. Look at what you find. Almost every business that does this for the first time learns something they didn’t expect.
I build custom operational dashboards for businesses with hidden demand patterns, multi-location retail, transport and logistics, booking-based services, e-commerce, and hospitality. The work starts with the decisions you need to make, not the charts.
See how the dashboard service works → or explore other data services if you’re not sure what you need.
Pingback: Citi Bike Case Study: A Powerful Mobility Dashboard Build
Pingback: Powerful Transport Seasonality Planning for Mobility Ops